Over the past few months,we’ve worked on our graphing tool, which has proved to be a wonderful aid in debugging. If you want to get the best help from us in diagnosing your problems, read on.
PowerDNS Authoritative Server and PowerDNS Recursor can both emit statistics using the ‘carbon’ format as used by Graphite. This means that feeding your stats into the very powerful Graphite software is as easy as setting:
carbon-server=37.252.122.50 # or 2a02:2770:8::2635:0:1
And from that point on, your PowerDNS product will send statistics to that IP address every 30 seconds. The target address should either run Graphite, or our own developed Metronome. Metronome is less powerful than Graphite, but very easy to setup. Graphs can be configured in Javascript, and out of the box, Metronome comes with support for graphing all PowerDNS products, plus the output of a small statistics program we wrote that emits network and CPU statistics.
To make this easier for everyone, we also run a public instance of Metronome on https://metronome1.powerdns.com/, and you are welcome to configure your PowerDNS products to send statistics by putting the following in pdns.conf or recursor.conf:
carbon-server= 37.252.122.50 # the IPv6 address 2a02:2770:8::2635:0:1 works as well
carbon-ourname=pick-something
Your data will then appear in the dropdown with the name ‘pick-something’. If you don’t pick your own name, PowerDNS will use your hostname, but you might consider that to be too revealing. It might also trample existing data. Carbon travels over port 2003, and if PowerDNS can’t connect to the server, nothing is interrupted.
For the PowerDNS Recursor, you can even enable carbon reporting at runtime using:
rec_control set-carbon-server 37.252.122.50 pick-something
To disable, run ‘rec_control set-carbon-server’.
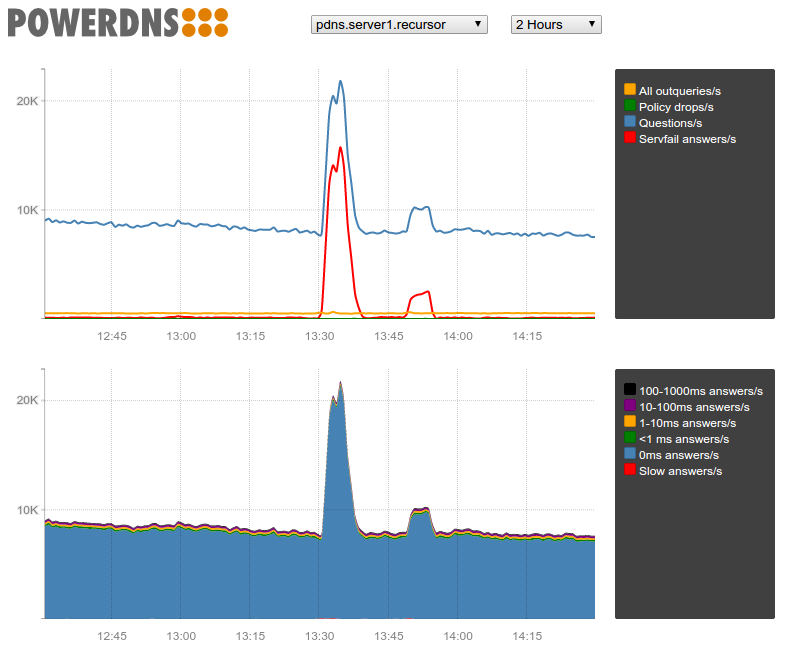
If you have any (performance) issues with PowerDNS you want help with, it is tremendously useful to turn on reporting to our Metronome instance – very often we can spot your problem from the graph quickly.
Now, our public Metronome service is of course public, but you can obscure your data by picking an innocuous carbon-ourname.
Private Metronome service is also available for holders of PowerDNS support agreements. Finally, Metronome is easy to install, so you can also benefit from it locally.
Enjoy!
